GBP/JPY Price Analyisis: Failure at 164.50, exposes the pair to selling pressure
- The GBP/JPY reaches a fresh two-day high at around 163.62.
- Investors’ optimism augmented their appetite for risk-sensitive currencies like the pound.
- GBP/JPY Price Analysis: Unless buyers reclaim 164.60, a re-test towards the 100-day EMA near 160.90 is on the cards.
The GBP/JPY erases Wednesday’s losses and soars on Thursday amidst a risk-on impulse that augmented appetite for riskier assets, meaning safe-haven peers sustaining losses. At 163.49, the GBP/JPY is trading at fresh two-day highs, up almost 1%.
Wall Street is set to finish Thursday’s session in the green, up between 1.14% and 2.22%. Recession fears that the US Federal Reserve would be unable to curb inflation without tipping the US economy into contractionary territory faded. Meanwhile, Fed officials reiterated that a 75 bps rate hike in July is the base case scenario while adding that the US economy is solid.
On Thursday, the GBP/JPY’s price action illustrates the pair opening around 162.00, followed by a dip towards the middle of the 161.00-162.00 area, and then rallying more than 150 pips, reaching a daily high at around 163.62. However, as the New York session ended, the cross-currency pair settled at around 163.52.
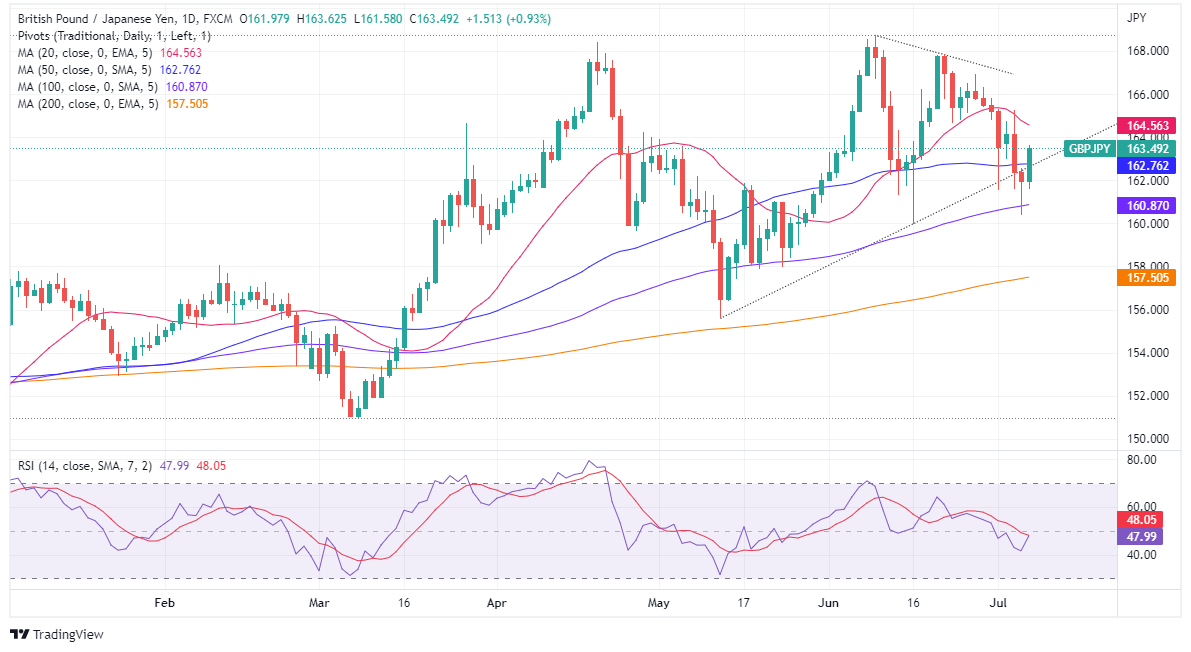
GBP/JPY Daily chart
The daily chart shows that the GBP/JPY is upward biased, though oscillators at negative territory might open the door for a reversal move. The RSI at 48 is still below the 50-midline; unless it breaches the latter, a retracement towards the 100-day EMA around 160.87 is on the cards. If buyers want to resume the uptrend, they must reclaim above the 20-day EMA at 164.56.
Otherwise, the GBP/JPY first support would be the 163.00 mark. Break below will expose the 50-day EMA at 162.76, followed by a fall towards the 100-day EMA at 160.87.
GBP/JPY Key Technical Levels