Back
2 Dec 2019
USD/CAD Technical Analysis: Greenback stable near 1.3300 against CAD
- USD/CAD is holding its ground despite broad-based USD weakness.
- The level to beat for buyers is the 1.3341/1.3354 resistance zone.
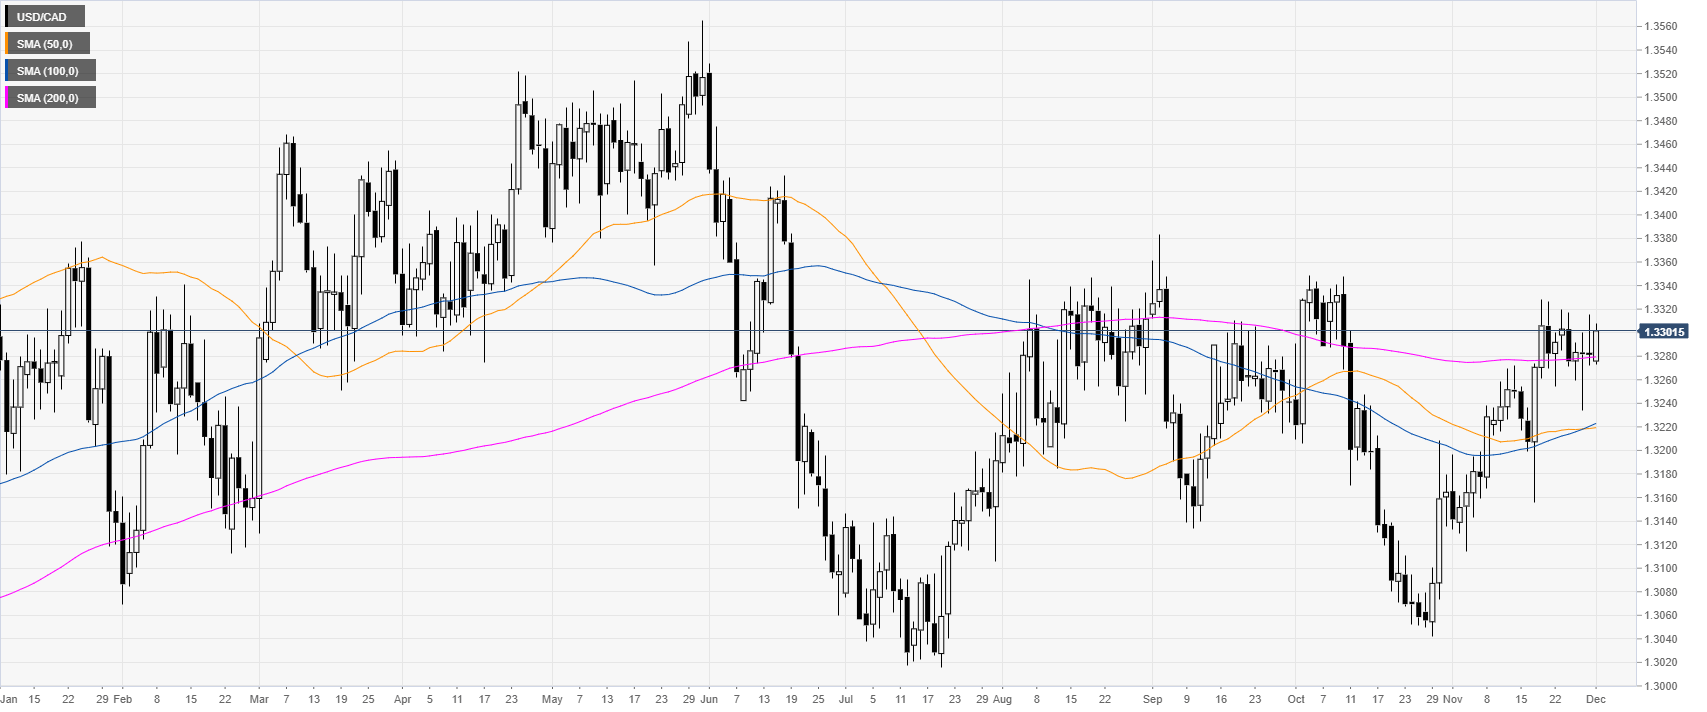
USD/CAD daily chart
The loonie on the daily chart is hanging near the November highs while trading above the main daily simple moving averages (DMAs). The currency pair remains currently immune to the USD weakness.
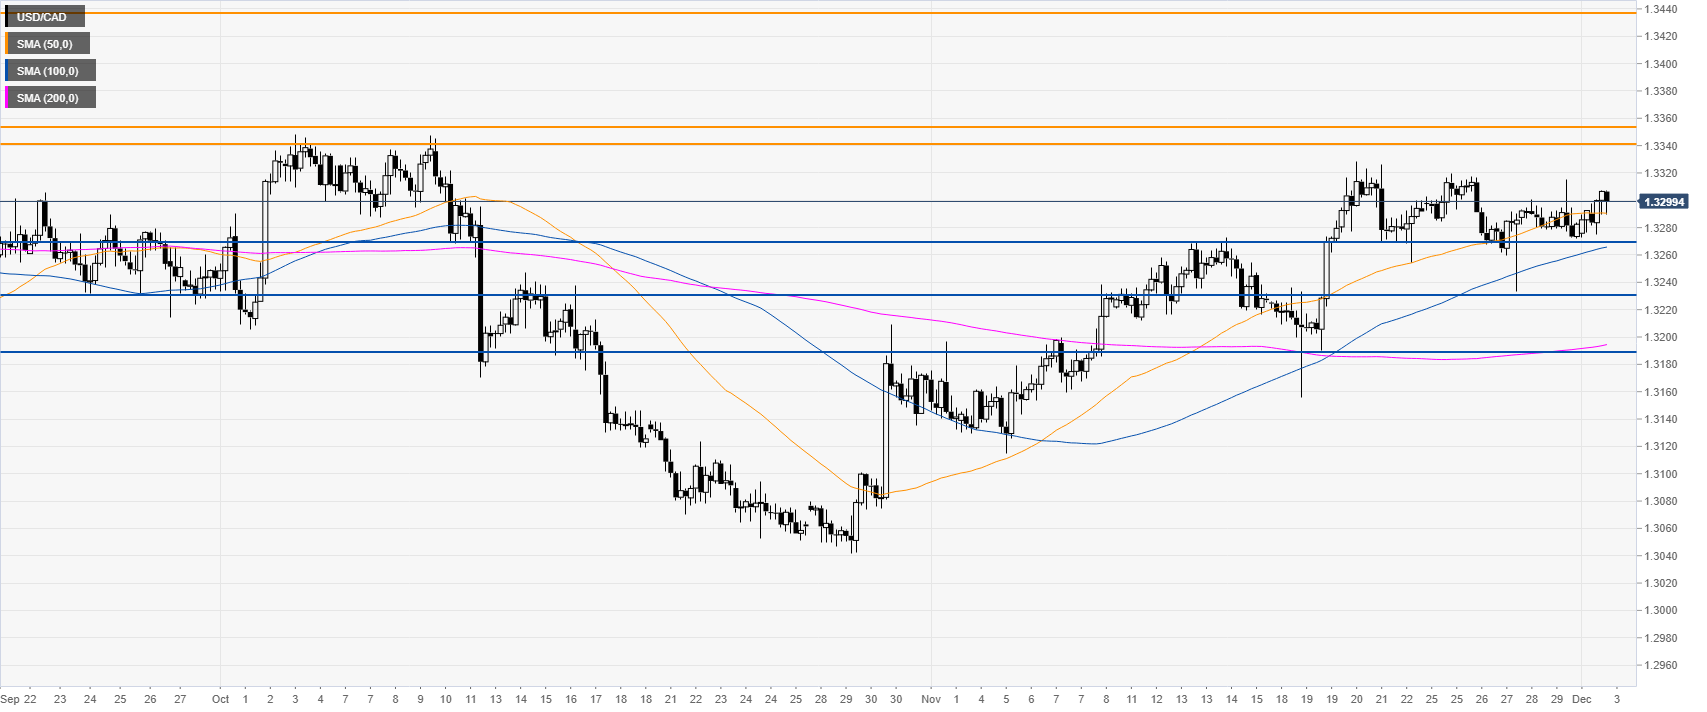
USD/CAD four-hour chart
USD/CAD is trading above the main SMAs, suggesting a bullish bias in the medium term. A break above 1.3341/1.3354 resistance zone is necessary for the market to appreciate towards 1.3437 in the medium term, according to the Technical Confluences Indicator.
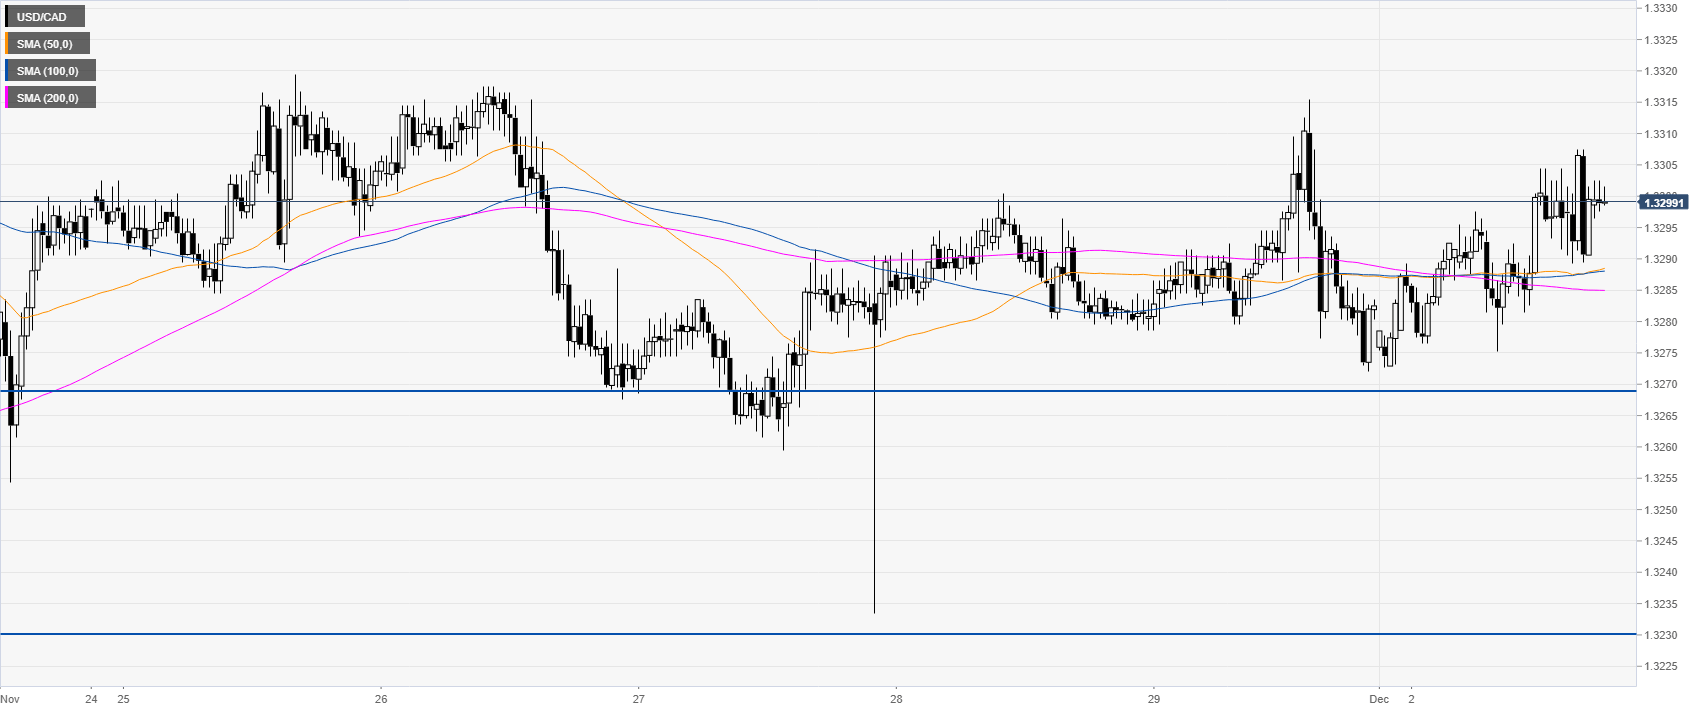
USD/CAD 30-minute chart
USD/CAD is trading above the main SMAs, suggesting a bullish momentum in the near term. Support is seen at the 1.3271 and 1.3230 price levels, according to the Technical Confluences Indicator.
Additional key levels