Back

30 Aug 2019
US Dollar Index technical analysis: DXY is challenging daily lows near 98.45 level
- DXY (US Dollar Index) is advancing towards the 2019 high as the market is holding above the 98.45 support.
- The next key resistance can be located near the 98.68 level.
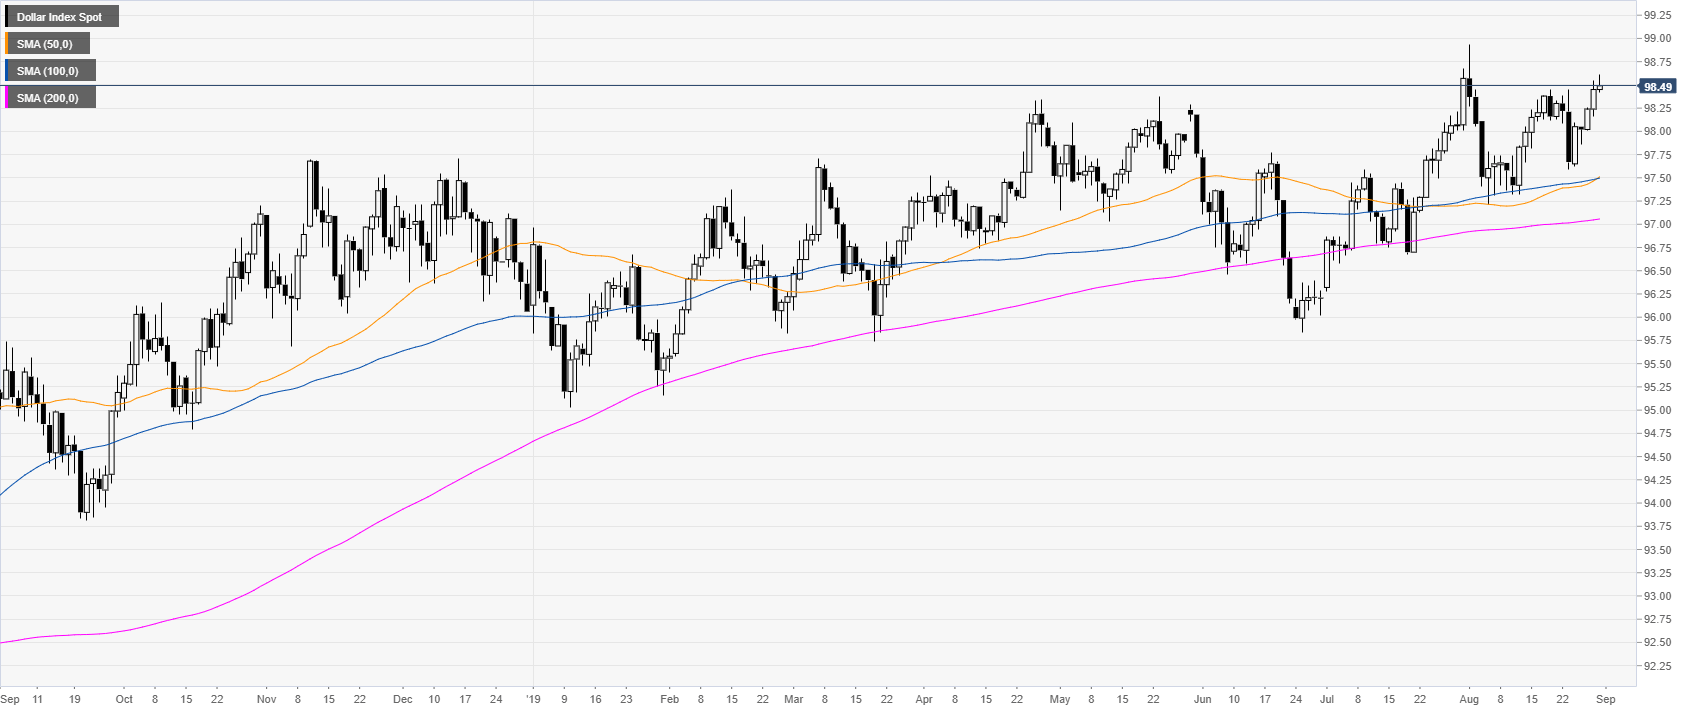
DXY daily chart
DXY (US Dollar Index) is in a bull trend above the main daily simple moving averages (DSMAs). The market is nearing the 2019 high at 98.94.
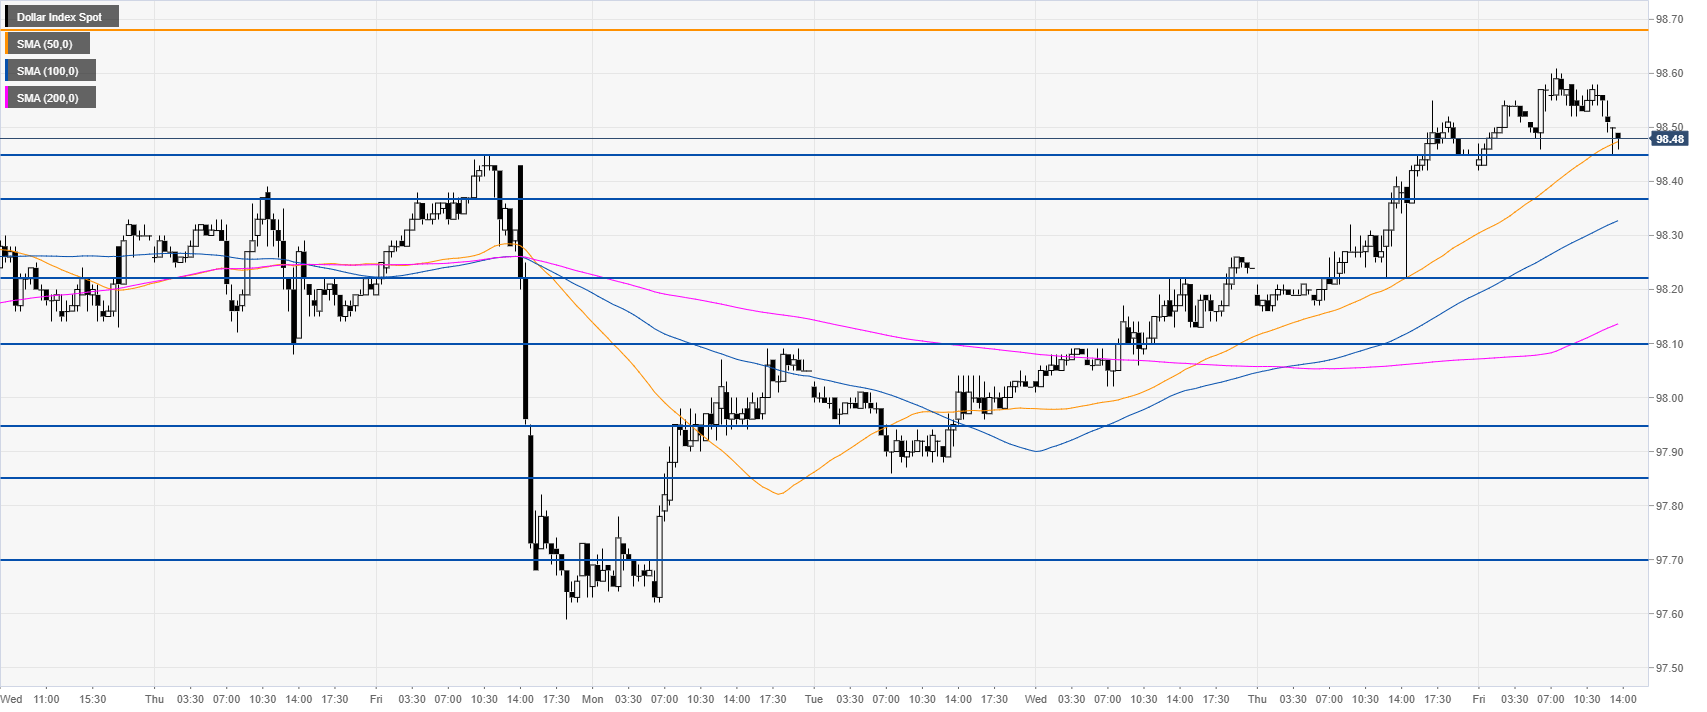
DXY 4-hour chart
DXY broke above 98.45 resistance opening the gates for a potential continuation up towards 98.68 and 98.94 (the 2019 high) on the way up. If the market holds above the 98.45 level, it would be seen as a bullish sign.
DXY 30-minute chart
The Greenback is trading above the main SMAs, suggesting bullish momentum in the short term. Immediate support is seen at the 98.45 and the 98.38 levels.