EUR/GBP Price Analysis: Slumps below 0.8600 after breaching technical support
- EUR/GBP struggles to maintain upward momentum, fails to break 0.8650 resistance, and is down by 0.10%.
- The 100-day EMA at 0.8652 is a significant barrier, resulting in a 0.75% slide since Thursday.
- Immediate support lies around the 20-day EMA at 0.8595, with the potential to further test the 0.8550 and YTD low of 0.8504.
- The pair must cross the 0.8600 level for an upside move, with subsequent resistance at the 50-day EMA (0.8610) and 100-day EMA (0.8649).
EUR/GBP extends its losses to two-consecutive days after struggling to break solid resistance at around 0.8650, with the pair sliding towards the 0.8590s area on Tuesday. At the time of writing, the EUR/GBP exchanges hands at 0.8597, down 0.10%.
EUR/GBP Price Analysis: Technical outlook
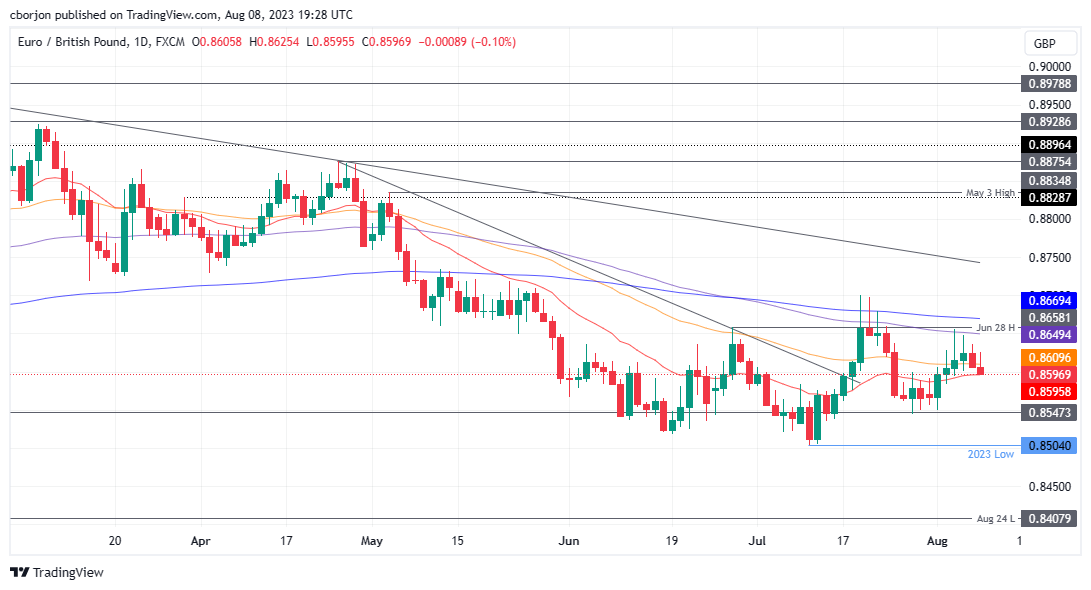
The EUR/GBP reversed its course to the upside after piercing the 100-day Exponential Moving Average (EMA) at 0.8652 last Thursday, but buyers could not hold to gains above the latter, opening the door for a pullback. Since then, the EUR/GBP slid 0.75%, below the 0.8600 figure, though price action stalled at the 20-day EMA at 0.8595.
If the EUR/GBP drops below the latter, the next support to emerge would be the August 1 low of 0.8550, ahead of testing the year-to-date (YTD) low of 0.8504.
Conversely, if EUR/GBP achieves a daily close above 0.8600, that could open the door for further gains. The first resistance would be the 50-day EMA at 0.8610, followed by the 100-day EMA at 0.8649. Once those levels are cleared, the next resistance would emerge at the 200-day EMA at 0.8669.
EUR/GBP Price Action – Daily chart